Hedgebook maps the liquidity options leave behind.
Dealer gamma, vanna and charm, priced against a live quote and replayable across the whole session.
Strike window, net or split, expiry and lookback across the top; the profile, the session replay and net gamma through the day beneath it.
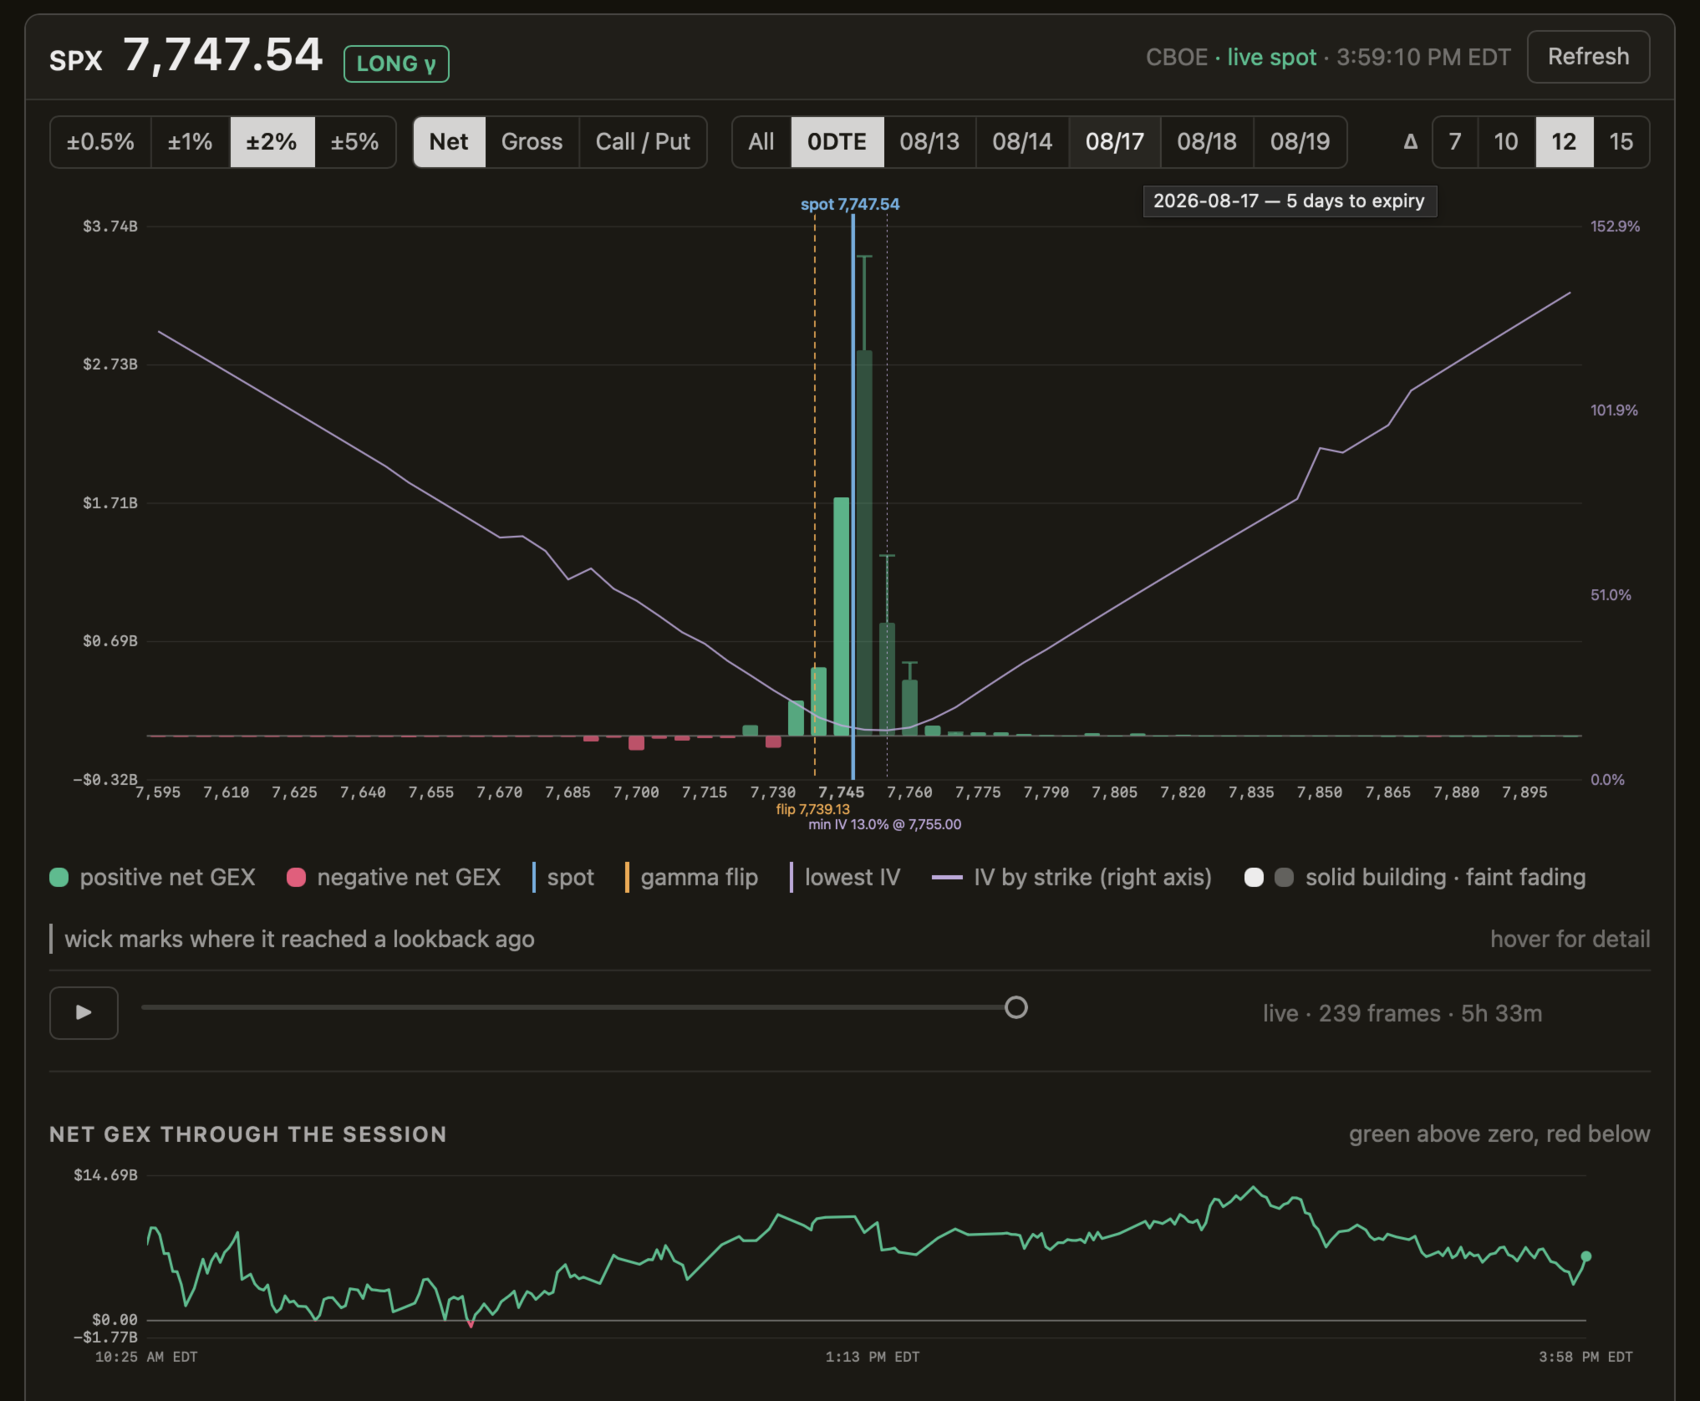
Held back for the public page — signed in, gamma is live, repriced to a live spot every minute.
What this is
Options dealers hedge their gamma. Where that gamma sits decides whether their hedging damps a move or accelerates it, which is why the shape of the profile matters more than any single number in it.
This reads the full option chain for six products, computes exposure per strike, and draws it. Calls and puts can be split apart, as they are here, or netted into the single profile the hero shows.
Watch the day happen
Every 0DTE profile is recorded from the opening bell. This is a real session, playing back frame by frame. Scrub it, pause it, or watch a wall build and drain on its own.
Notice the bars fading in and out as it runs. Each one is shaded by whether its exposure is building or bleeding off against the frames just before it, so the direction of travel is visible at a glance, before you read a single number.
Four things it does differently
Most of what a gamma dashboard shows is arithmetic anyone can do. These are the four places where the answer changes.
- The spot is live, so the gamma is too
- Free and low-cost chains run about fifteen minutes behind, and open interest only updates overnight, so that delay costs nothing. Spot is the term that moves, and gamma is recomputed from Black-Scholes against a live quote on every poll.
- Zero gamma is solved, not eyeballed
- Most tools label the flip where the running total crosses zero on the current ladder, which is a property of the drawing. This solves for the spot price at which total gamma would actually be zero, repricing the whole book to find it.
- The session is a tape you can scrub
- Every 0DTE profile is recorded from the opening bell and written to disk. Drag backwards through the day and the bars animate between frames, so you watch a wall build or drain rather than inferring it from a snapshot.
- Change is in the bars, not a second chart
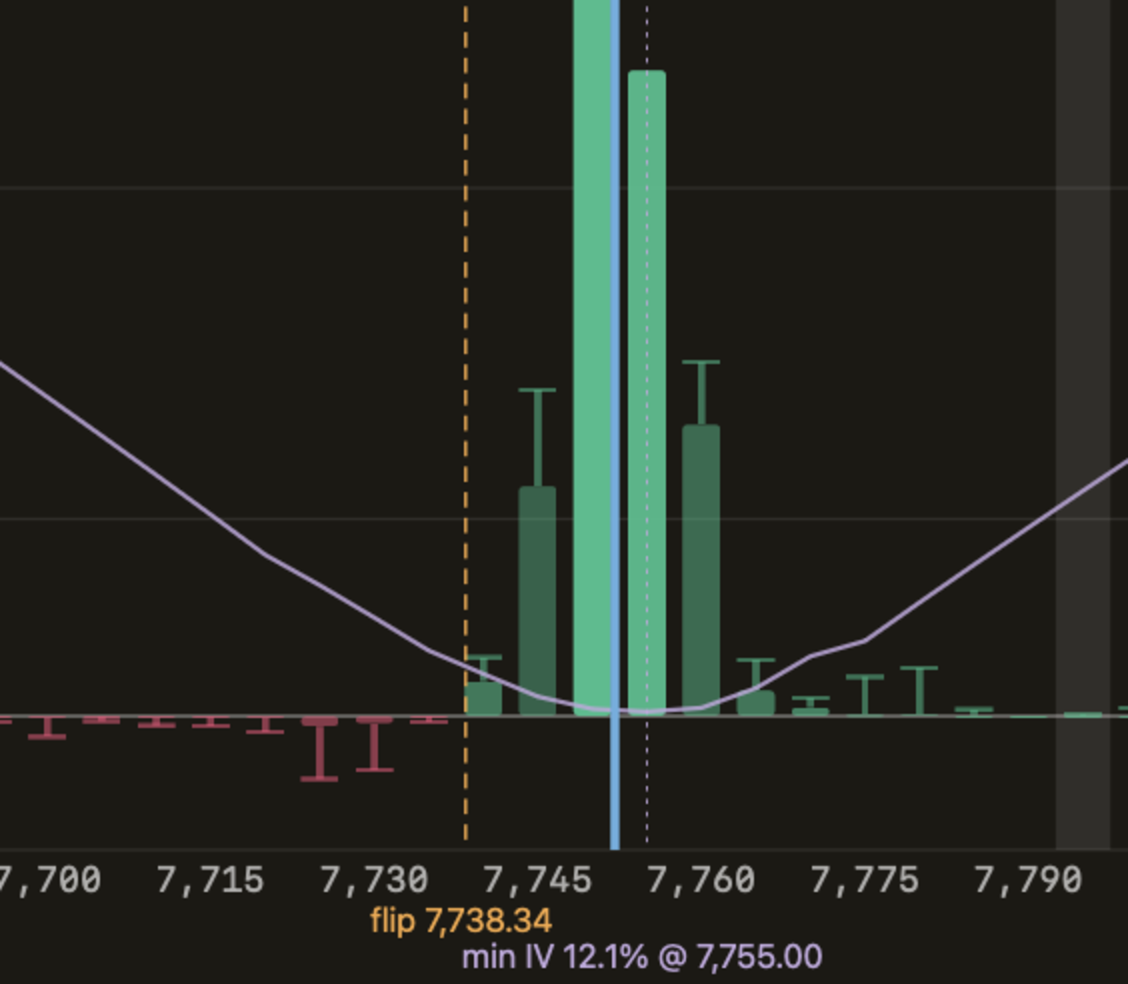
- A profile says where exposure is, never which way it is going, and reading that usually means holding two screenshots side by side. Here a building strike reads brighter and a fading one keeps a wick out to where it reached.
SPX near the money, twelve minutes of change on one ladder. The bright bars are where gamma is building. The dimmer ones are bleeding off, and each keeps a wick out to the level it held twelve minutes earlier.
The gap between a bar and its wick is what has gone — in the same units as the bar, on the same axis, so height and direction land in one glance.
How the number is built
Per contract, exposure is gamma times open interest times contract size times spot squared, scaled to a one percent move. Calls count positive and puts negative, the convention that makes the sign of the total mean something: positive gamma damps moves, negative gamma amplifies them.
Gamma itself comes from Black-Scholes at the live spot rather than from the chain, which is what keeps the profile current between chain updates.
- Chain
- Full option chain, all strikes
- Refresh
- 60 seconds
- Spot
- Live quote, per poll
- Gamma
- Black-Scholes, recomputed
- Replay
- 0DTE, full session
- Products
- SPX, IWM, SPY, QQQ, NVDA, TSLA
The alpha is closed while the numbers get checked
Accounts are created by invitation. If you already have one, everything is behind the log in.